



-
-
ENMK06747
Rat PG-F, PGF1α, PGF2α, PGH2 Multiplex ELISA Kit
-
Assay Range:PG-F: 7.8-500 pg/mL; PGF1α: 7.8-500 pg/mL; PGF2α: 7.8-500 pg/mL; PGH2: 7.8-500 pg/mL
-
Sensitivity:PG-F: 2.6 pg/mL; PGF1α: 2.6 pg/mL; PGF2α: 2.6 pg/mL; PGH2: 2.6 pg/mL
-
Specification:96T
-
Shelf Life:12 months when stored at -20 ℃
-
Storage Conditions:-20 ℃; short-term storage at 2-8 ℃ is acceptable for up to 2 weeks
-
Purpose:Intended for the in vitro quantitative determination of Rat PG-F, PGF1α, PGF2α, PGH2 in liquid samples.
-
Application:Multiplex
 Download The Manual
-
|
PART
|
96T
|
48T
|
STORAGE
|
|
Pre-Coated Plate
|
8×12
|
8×6
|
4 ℃ / -20 ℃
|
|
Pre-Mixed Standards
|
2 vials
|
1 vial
|
4 ℃ / -20 ℃
|
|
Pre-Mixed Biotinylated Antibody (1:100)
|
1 vial
|
1 vial
|
4 ℃ / -20 ℃
|
|
Enzyme Conjugate(1:100)
|
1 vial
|
1 vial
|
4 ℃ / -20 ℃
|
|
Enzyme Diluent
|
1 vial
|
1 vial
|
4 ℃ / -20 ℃
|
|
Antibody Diluent
|
1 vial
|
1 vial
|
4 ℃ / -20 ℃
|
|
Standard Diluent
|
1 vial
|
1 vial
|
4 ℃ / -20 ℃
|
|
Sample Diluent
|
1 vial
|
1 vial
|
4 ℃ / -20 ℃
|
|
Washing Buffer (1:25)
|
1 vial
|
1 vial
|
4 ℃ / -20 ℃
|
|
Color Reagent A
|
1 vial
|
1 vial
|
4 ℃ / -20 ℃
|
|
Color Reagent B
|
1 vial
|
1 vial
|
4 ℃ / -20 ℃
|
|
Color Reagent C
|
1 vial
|
1 vial
|
4 ℃ / -20 ℃
|
|
Manual
|
1 set
|
1 set
|
RT
|
- Microplate reader (450nm detection wavelength filter,with optional 570nm or 630nm correction wavelength filters).
- Washer (adjustable injection volume to ensure that each well receives 350μL without overflow).
- Clean benches,biological safety cabinets,fume hoods.
- High-precision single-channel pipette (range 0.5-10μL,20-200μL,200-1000μL).
- High-precision multi-channel pipette (8 or 12,the range of 50-300μL).
- 37℃ incubator.
- Low temperature centrifuge.
- Refrigerators (4℃,-20℃,-86℃).
- Analytical balance.
- Scissors,tweezers,pliers,etc.
- Plate mixer,low-frequency oscillator,etc.
- Centrifuge tubes (capacity of 1.5 mL,5 mL,etc.).
- Disposable pipette tips (range of 0.5-10 μL-20 μL,20-200 μL,200-1000 μL).
- Pure water or distilled water.
- Coordinate paper.
- Absorbent paper.
01.Serum
Place collected whole blood in refrigerator at 4 ℃ overnight. Then centrifuge for 10mins at 1000-3000 rpm. Take supernatant and either test immediately or place samples at -20 ℃/-80 ℃(1-3 months) for storage.
02.Plasma
Take plasma where EDTA, sodium citrate, or heparin has been added as anticoagulant. Mix well. Centrifuge mixture for 10mins at 1000-3000 rpm. Take supernatant and test immediately or place samples at -20 ℃ /-80 ℃ (1-3 months) for storage.
03.Tissue Homogenate
Take tissue slices which have been washed in 0.01 M PBS and then a tissue protein extraction reagent has been added according to proportion of 1 g to 5-10 mL and then mixed on ice bath. After sufficient homogenization, please then centrifuge for 10mins at 5000-10000 rpm. Take supernatant for immediate testing, or place samples at -20 ℃/-80 ℃ (1-3 months) for storage.
04.Cell Culture
Centrifuge for 10 mins at 1000-3000 rpm. Take supernatant for immediate testing, or place samples at -20 ℃/-80 ℃ (1-3 months) for storage.
05.For Urine, Ascites, Cerebrospinal Fluid, etc
Centrifuge for 10mins at 1000-3000 rpm. Take supernatant for immediate testing, or place samples at -20 ℃/-80 ℃ (1-3 months) for storage.
|
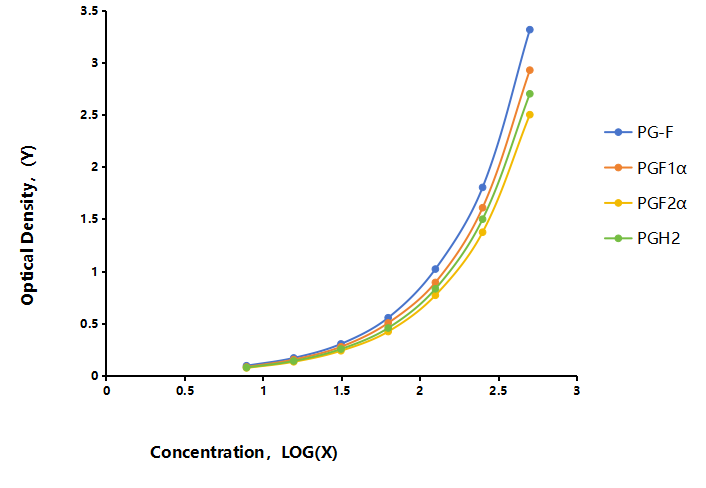
TYPICAL DATA
|
Reference STD1
|
Reference STD2
|
Reference STD3
|
Reference STD4
|
Reference STD5
|
Reference STD6
|
Reference STD7
|
Reference STD8
|
|
PG-F, pg/mL
|
500
|
250
|
125
|
62.5
|
31.25
|
15.625
|
7.813
|
0
|
|
PG-F, OD.
|
2.291
|
1.222
|
0.714
|
0.385
|
0.216
|
0.122
|
0.065
|
0.043
|
|
PGF1α, pg/mL
|
500
|
250
|
125
|
62.5
|
31.25
|
15.625
|
7.813
|
0
|
|
PGF1α, OD.
|
3.033
|
1.736
|
0.955
|
0.525
|
0.295
|
0.164
|
0.087
|
0.058
|
|
PGF2α, pg/mL
|
500
|
250
|
125
|
62.5
|
31.25
|
15.625
|
7.813
|
0
|
|
PGF2α, OD.
|
3.578
|
2.09
|
1.105
|
0.639
|
0.344
|
0.189
|
0.106
|
0.074
|
|
PGH2, pg/mL
|
500
|
250
|
125
|
62.5
|
31.25
|
15.625
|
7.813
|
0
|
|
PGH2, OD.
|
3.203
|
1.743
|
0.969
|
0.554
|
0.296
|
0.165
|
0.091
|
0.063
|
STANDARD CURVE
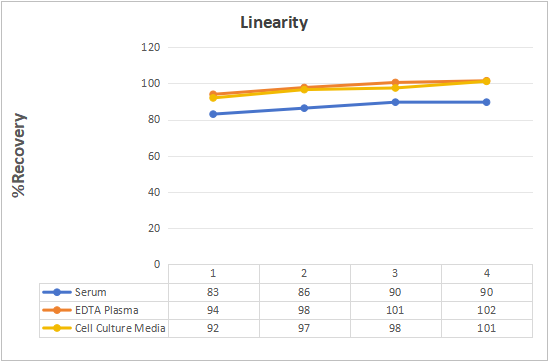
To assess linearity of the assay, samples were spiked with high concentrations of Rat PG-F, PGF1α, PGF2α, PGH2 and diluted with the appropriate calibrator diluent to produce samples with values within the dynamic range of the assay.
|
Matrix
|
Scope %
|
Average % Recovery Rate
|
|
serum(n=5)
|
83-94
|
88.5
|
|
EDTA plasma(n=5)
|
94-97
|
95.5
|
|
Cell Culture Media(n=5)
|
92-100
|
96
|
|
Within-Run Precision
|
Inter-Batch Precision
|
|||||
|
Sample
|
1
|
2
|
3
|
1
|
2
|
3
|
|
n
|
20
|
20
|
20
|
20
|
20
|
20
|
|
CV%
|
6.7
|
6.3
|
6.8
|
9
|
7.7
|
7.9
|
-
01The re-dissolved standard cannot be stored again once prepared, so please do not attempt to re-freeze it once it has been reconstituted.
-
02Due to shaking/inversion during transport, centrifuging of the tubes/bottles of the kit might be necessary to consolidate the material contained within. Tubes should be shaken manually or centrifuged for 1 min at 1000 rpm to pool all material to the bottom.
-
03Concentrated Washing Buffer might crystallize slightly. Use a water bath to help the dissolution during diluting process. The crystals must be totally dissolved when preparing the Washing Buffer.
-
04The prepared standard is intended to only be a single-use aliquot, so please do not try to re-use the standard that has already been tested. Please use the second vial provided if you run the assay again.
-
05Only use reagents/components that came directly with this kit. Do not mix batches/lots from other orders of this kit, or from different kits.
-
06Ensure the reagents are well mixed. For the reagents in the microplate, adequate mixing is particularly important for accurate test results. It is recommended to employ a micro-oscillator (at the lowest frequency). If a micro-oscillator is not available, please slightly shake the microplate manually for 1 min, in a circular motion in order to make sure the wells are sufficiently mixed.
-
07Please ensure the kit has been brought to room temperature prior to beginning the assay.
-
08Standards are always recommended to be tested in duplicate or triplicate.
-
09Place the unused microplate strips into the foil bag at 2-8 ℃ for storage (if you intend to use the strips within a relatively short timeframe).
-
10The chromogen reagent is sensitive to light, therefore please avoid exposing to light.
-
11Kits that have passed their expiration date should not be used.
-
12When using dual-wavelength, the wavelengths should be set at 450nm and 630nm.
-
13All the samples, Washing Buffer and wastes should be treated as biowaste. Color Reagent C is 1M sulfuric acid, so please pay close attention to safety when it is used.
-
14Sample addition should always be done via pipette or similar instrument. Calibrate the instrument prior to running the assay in order to avoid experimental errors. Please add samples to the wells quickly, as it is recommended to control the sample addition time to less than ~5 mins. You might want to consider multi-pronged pipettes if this helps with the loading time.
-
15Do not re-use the adhesive strips. Cut them to size if you only use part of the plate at a time. Always discard after use.
-
16New standard curves should be made for every new run of the assay. If the observed concentrations of test samples are too high (OD value of the sample is higher than that of standard well maximum concentration), dilute by a certain factor, and correct for said factor in the end calculations.
-
17Samples containing NaN3 cannot be tested due to NaN3 inhibiting the activities of horseradish peroxidase (HRP).
-
18When washing plate via plate washer, the volume of buffer injected into each well should be slightly more than 350μL. Make sure the sampling head is not jammed or blocked. Also, if washing by hand, please take care when using an absorbent material to remove excess water – make sure this absorbent material wasn’t used to clean any of the other reagents to prevent contamination.
-
19After the coloration reaction termination by Color Reagent C, please read OD within 10 mins.
-
20If duplicate wells were performed, the mean value of the wells should be used.
-
21Hemolyzed samples may cause false positive results, so we consider these samples to be incompatible with this kit.
-
22During the assay, please try to control the humidity to ~60%.
-
23We recommend regularly checking the thermostat and calibration in order to confirm the incubation temperature remains at a stable 37 ℃.